Europe’s Fastest-Growing Listed Companies: Sweden Leads the New Ranking


Set Trending Topics as a preferred source on Google.
A new academic ranking reshuffles Europe’s stock market league table. The European Growth Leaders 2026 name the 100 EU-27 companies that grew the most on three fronts at once between fiscal 2022 and fiscal 2025: revenue, net income and total shareholder return. At the top sits Synektik, a Polish medical technology group that is barely known outside Warsaw. The list was compiled by a research unit at SKEMA Business School, drawing on financial data from the London Stock Exchange Group.
The Top 20 at a Glance
Two ties mean the first 20 ranks cover 21 companies.
| Rank | Company | Country | Sector | Revenue | Net Income | Stock Return |
|---|---|---|---|---|---|---|
| 1 | Synektik | Poland | Healthcare | +364% | +1,028% | +875% |
| 2 | Newag | Poland | Industrials | +176% | +1,640% | +641% |
| 3 | NewPrinces | Italy | Consumer non-cyc. | +299% | +5,928% | +346% |
| 4 | Rainbow Tours | Poland | Consumer cyc. | +112% | +1,242% | +856% |
| 5 | Rosetti Marino | Italy | Energy | +148% | +695% | +731% |
| 6 | Končar D&ST | Croatia | Industrials | +101% | +509% | +1,152% |
| 7 | Zinzino | Sweden | Consumer cyc. | +141% | +394% | +579% |
| 8 | Benefit Systems | Poland | Industrials | +164% | +360% | +409% |
| 9 | Dalekovod | Croatia | Industrials | +104% | +1,466% | +268% |
| 10 | Campine | Belgium | Basic Materials | +141% | +258% | +409% |
| 11 | Grenergy Renovables | Spain | Utilities | +531% | +746% | +211% |
| 12 | Shelly Group | Bulgaria | Technology | +220% | +181% | +450% |
| 13 | Končar Group | Croatia | Industrials | +88% | +325% | +527% |
| 14 | Dynavox Group | Sweden | Technology | +109% | +251% | +379% |
| 15 | Italian Exhibition Group | Italy | Industrials | +66% | +3,883% | +277% |
| 16 | Cyber_Folks | Poland | Technology | +143% | +193% | +355% |
| 17 | Friedrich Vorwerk Group | Germany | Industrials | +91% | +405% | +279% |
| 17 | ANY Biztonsági Nyomda | Hungary | Industrials | +73% | +295% | +485% |
| 19 | Saab | Sweden | Industrials | +94% | +197% | +434% |
| 20 | Maire | Italy | Industrials | +103% | +190% | +367% |
| 20 | Kri-Kri Milk Industry | Greece | Consumer non-cyc. | +91% | +974% | +229% |
What the Number One Does
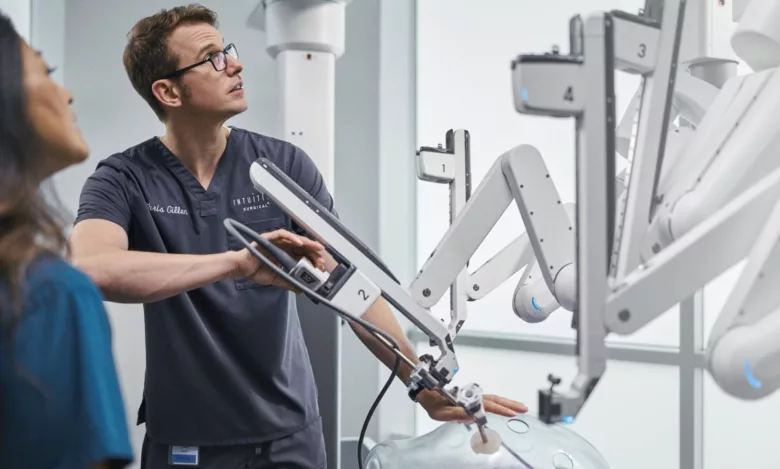
Synektik is a Warsaw-based health technology group built on four pillars: surgical robotics, diagnostic imaging, nuclear medicine and medical IT. Its largest business is the distribution of Intuitive’s da Vinci surgical systems in Poland, Czechia and Slovakia, where roughly 142 units have been installed to date, alongside the Ion robotic bronchoscopy platform. In parallel, the company produces PET radiopharmaceuticals for cancer diagnostics at three of its own cyclotron facilities and develops software for image archiving and radiation dose monitoring.
Growth rests on a mix of equipment sales and recurring revenue from maintenance, consumables and service contracts. Synektik has recently expanded into the Baltic states and Ukraine. Its latest nine-month figures show revenue of 733.4 million zloty and net profit of 138 million zloty from continuing operations, roughly 173 million and 32 million euros respectively.
Sweden Supplies the Most Companies
Across the full list of 100, Sweden leads with 17 entries, among them the defence group Saab, electronics manufacturer Hanza and military technology specialist MilDef. Germany follows with 15 companies and Poland with 14.
| Country | Companies in the Top 100 |
|---|---|
| Sweden | 17 |
| Germany | 15 |
| Poland | 14 |
| Italy | 10 |
| Spain | 10 |
| Belgium | 6 |
| Croatia | 6 |
| France | 5 |
| Denmark | 4 |
| Austria | 3 |
| Finland | 2 |
| Netherlands | 2 |
| Bulgaria, Czechia, Greece, Hungary, Portugal, Romania | 1 each |
The picture shifts at the very top. Among the first 21 placements, five companies come from Poland, four from Italy and three each from Croatia and Sweden. Germany appears once there, through Friedrich Vorwerk, while Austria is absent from that group.
Austria Places Three Companies
Three Austrian companies make the top 100: airline caterer DO & CO at rank 31 with a 226% revenue increase, control centre systems maker Frequentis at rank 84 and Vienna Airport at rank 86. DO & CO is therefore the best-placed Austrian name, ahead of groups such as Rheinmetall (57), SAP (89) and Inditex (94).
What the List Says About European Growth
The sector split stands out. Industrials dominate the ranking, followed by technology and healthcare. Among the industrial names, defence, energy infrastructure and rail cluster together: Saab, Rheinmetall, MilDef, Invisio, Leonardo, Friedrich Vorwerk, Newag, Končar and Dalekovod have all benefited from investment cycles that accelerated sharply from 2022 onwards.
The geographic shift eastward and toward smaller markets is just as clear. Poland, Croatia, Hungary, Bulgaria, Romania and Czechia together account for 24 companies, more than Germany and France combined. Several of them are small caps with market values in the hundreds of millions, where percentage gains naturally run higher than at established blue chips. Large names such as SAP, Inditex, Prysmian, ACS and Leonardo sit at the lower end of the list, having grown solidly yet more moderately in relative terms.
As a read on European growth dynamics, the list offers one clearly defined slice of the picture: the listed companies that expanded revenue, profit and market value simultaneously across four fiscal years.
Who Is Behind the Ranking
The publisher is the Growth Leaders Observatory, which describes itself as an independent, academic and non-commercial body. The project is led by Francesco Castellaneta, Full Professor of Strategy and Entrepreneurship at SKEMA Business School, part of Université Côte d’Azur (GREDEG). Its scientific committee comprises Diego Zunino, Dean of Research at SKEMA, and Jackie Krafft, CNRS research director and head of GREDEG.
The financial data comes from LSEG Workspace under a research agreement with the London Stock Exchange Group. The feed covers standardised fields only: revenue, net income, market capitalisation, share price, total return and basic issuer information. According to the observatory, the calculation itself runs independently under its own rules.
The Method: Three Metrics, Equally Weighted
The methodology works in four steps:
- Universe: The starting point is active primary listings of operating companies in the EU-27, with financials and real estate excluded. Minimum criteria cover listing age, reporting standards, share price and company size. That screen covered 1,572 listings.
- Growth gate: Revenue must have risen, net income must be positive in both 2022 and 2025 and higher at the end, and the stock return over the window must be positive. A total of 316 companies cleared every condition.
- Scoring: Each remaining company is ranked three separate times, on revenue growth, net income growth and total shareholder return including dividends. The three rank numbers are added up and the lowest total wins. All three metrics therefore carry equal weight, which favours balanced performers over companies that excel in a single dimension.
- Frozen annual record: The window runs from fiscal 2022 to fiscal 2025. Once published, membership and ranks stay fixed for that edition.
The observatory sets out the limits of the approach itself. Only the start and end points are measured, leaving the path in between out of view. Fiscal 2022 was an unusual base after the pandemic and the energy price shock, so part of the gains reflects recovery as much as fresh momentum. And the selection is a cohort of winners rather than a representative sample of the EU-27 economy. The observatory frames the exercise as a retrospective analysis and explicitly rules out any reading as investment advice.
There is also a note on the use of AI. The editorial company profiles on the website were drafted with AI assistance from linked public sources. For selection, scoring and ranking, the operators state that no AI was involved.