Street of Hormuz Blockade Could Disrupt $1.2 Trillion in Annual Global Trade


Set Trending Topics as a preferred source on Google.
A new study by the Supply Chain Intelligence Institute Austria and the Complexity Science Hub Vienna quantifies for the first time the full extent of the economic damage caused by a blockade of the Strait of Hormuz. The result is alarming: approximately 1.2 trillion US dollars in annual trade flows could be affected if the closure persists. Energy importers in Asia and Europe would be hit particularly hard.
The Bottleneck of the Global Economy
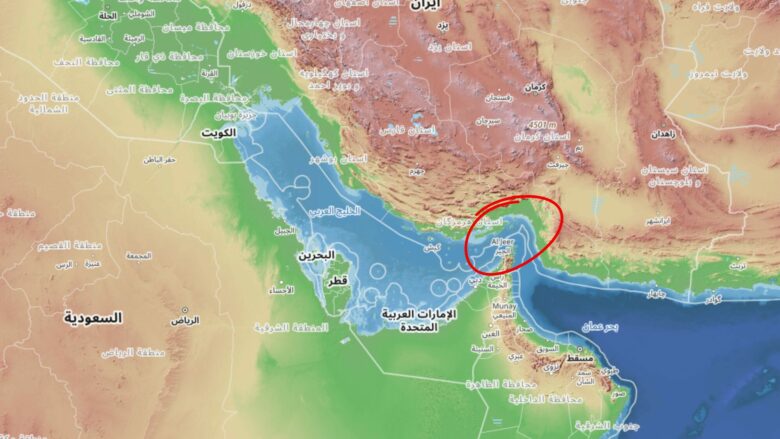
The Strait of Hormuz, just 33 kilometres wide at its narrowest point, is the world’s most critical maritime chokepoint. Around 20 percent of the global oil supply passes through this waterway between Oman and Iran every day. Five countries — Iran, the United Arab Emirates, Qatar, Kuwait, and Bahrain — are entirely dependent on this route for their maritime exports.
The researchers analysed trade data from 2022 and 2023 and used an agent-based shipping model called TIDES to simulate three scenarios: a blockade of 14, 28, and 56 days. The central finding is: the longer the closure lasts, the disproportionately greater the damage becomes.
“Short disruptions of less than two weeks would likely have limited economic consequences. However, disruptions of more than four weeks generate disproportionately larger effects, as cascading delays amplify throughout the global shipping network.”
Who Is Most Affected?
Asia bears the greatest risk, because the economies there have built their industrial strategies on reliable energy supplies from the Gulf. The annual import volumes from the Hormuz-dependent Gulf states are enormous.
| Country | Annual Imports (bn USD) | Main Products |
|---|---|---|
| China | 97 | Crude oil, LNG, petrochemicals |
| India | 74 | Crude oil, petroleum products |
| Japan | 63 | Crude oil, LNG |
| South Korea | 30 | Crude oil, LNG |
| Turkey | 14 | Petroleum products, steel |
| USA | 13 | Fertilisers, petrochemicals |
Europe: Concentrated Vulnerability
The European Union imports around 47 billion US dollars annually from the Hormuz-dependent Gulf states. However, the impact is very unevenly distributed. Five countries — Italy, Belgium, France, Germany, and the Netherlands — account alone for 79 percent of the total EU volume. The United Kingdom adds a further 12.9 billion US dollars per year.
United Kingdom: 12.9 billion US dollars per year
The United Kingdom is the most exposed European country. Qatari liquefied natural gas and propane account for 5.9 billion US dollars, nearly half of British Gulf imports. A further 2.9 billion US dollars comes from Kuwaiti petroleum products. This concentration on energy creates a genuine vulnerability, as LNG is barely replaceable at short notice.
Italy: 9.8 billion US dollars per year
Italy is the most affected country within the EU. Qatar supplies goods worth 6.3 billion US dollars annually, of which 4.4 billion alone takes the form of liquefied natural gas and 3.2 billion as propane. Italy’s energy infrastructure is heavily reliant on these gas supplies. Alternative LNG suppliers from the US, Algeria, or Norway do exist, but switching requires investment in terminal capacity and new contracts.
Belgium: 8.2 billion US dollars per year
Belgium plays a special role as a European gas distributor. The LNG terminal in Zeebrugge imports 5.8 billion US dollars of Qatari liquefied natural gas annually. In addition, 2.1 billion US dollars in diamonds from the Emirates flow through the trading hub of Antwerp. While diamond flows can be flexibly rerouted, the LNG dependency is structurally embedded.
France and Germany: Better Positioned
France imports 8.1 billion US dollars annually from the Gulf, spread across several suppliers and product categories. Its own LNG import terminals and the high share of nuclear power and renewable energy provide considerable buffers. Germany accounts for 5.7 billion US dollars, with a large portion attributable to industrial equipment from the Emirates — goods that are easier to replace than energy.
Austria: Minimal Direct Exposure
Austria, with direct imports of only 0.3 billion US dollars per year, is barely directly affected. The real danger comes indirectly: if gas prices rise in Italy, Belgium, or the United Kingdom, this is transmitted to the Austrian energy market through the European pipeline networks.
More Than Just Oil and Gas
The study also sheds light on product categories that receive less attention in public debate but are strategically significant.
- Fertilisers: The five Hormuz-dependent Gulf states supply 8 to 10 percent of global fertiliser exports, worth 13.5 billion US dollars. The largest buyers are the USA and Brazil. Since fertilisers are purchased months before use, the ongoing spring season of 2026 is still secured. However, price increases for the 2027 harvest are possible.
- Steel and iron: Iran exports construction steel primarily to neighbouring countries. Central Asian states such as Turkmenistan, Pakistan, and Tajikistan are particularly vulnerable, as they have few alternatives. For most other countries, project delays rather than supply crises are the likely consequence.
- Speciality gases for semiconductors: Qatar supplies 98 percent of all Gulf exports of neon, helium, argon, krypton, and xenon — totalling around 3 billion US dollars annually. These gases are essential for chip production. However, since the industry holds strategic stockpiles for 3 to 6 months and alternative suppliers exist worldwide, the risk remains limited in the event of short disruptions.
The Shipping Network and the Tipping Point
The TIDES model simulated 10,000 tankers as individual actors and calculated how many shipping days are lost due to the blockade. For China, a 14-day closure results in a loss of around 0.5 days, a 28-day closure in 1.7 days, and a 56-day closure in 4.3 days. The EU and the United Kingdom together account for 0.7, 1.0, and 2.2 lost days across the three scenarios.
A structural phenomenon is decisive here: the damage does not scale linearly with duration. A 56-day blockade causes more than twice as many disruptions as a 28-day one, even though the duration is only doubled. From around four weeks onwards, delays begin to amplify throughout the global network. Ports become congested, schedules fall out of sync, and the consequences spread far beyond the directly affected routes.
What Does This Mean for Policy?
The researchers derive three clear recommendations from their analysis:
- A swift resolution is the top priority. Short disruptions of a few weeks can be absorbed by the global shipping system. Every additional week increases the risk disproportionately.
- Contingency plans for longer scenarios are necessary. Given the non-linear escalation of damage, preparing for disruptions of one month or longer is worthwhile, even if the probability appears low.
- Clear communication prevents panic. Historical experience from the Ukraine crisis shows that panic buying and panic can significantly amplify the effects of supply disruptions. Authorities should communicate proactively and transparently.
The study makes clear: the actual economic damage of a prolonged Hormuz blockade would manifest less through physical shortages of goods than through persistently high prices, rising production costs for energy-intensive industries, and growing recessionary pressure. The window for a solution that the global economy can still absorb closes with every additional week of closure.